A Complete Guide to Single-Cell RNA Sequencing Analysis Output Files
📁 Directory Structure • 📋 File Details • 🧬 Data Matrix • 📊 Analysis Results • 📊 Report Interpretation
After the single-cell RNA analysis is complete, a standardized file and subdirectory structure is generated in the specified output directory, specifically for gene expression profile analysis and cell type identification. This document details the content, format, and purpose of each output file to help users fully understand and efficiently utilize the single-cell RNA analysis results.
💡 Tip: All output files use standard formats compatible with mainstream single-cell analysis tools (such as Scanpy, Seurat, etc.) and follow internationally recognized data format specifications.
.
├── analysis/                      # Downstream analysis results directory
│   ├── cluster.csv                # Cell clustering results file
│   ├── marker.csv                 # Differentially expressed gene marker file
│   └── QC_Cluster.h5ad            # AnnData object after quality control and clustering
├── anno_decon_sorted.bam          # Aligned, annotated, and sorted BAM file
├── anno_decon_sorted.bam.bai      # BAM index file
├── filter_feature.h5ad            # Filtered feature matrix (AnnData format)
├── filter_matrix/                 # Filtered gene expression matrix directory
│   ├── barcodes.tsv.gz            # Cell barcode file
│   ├── features.tsv.gz            # Gene/feature information file
│   └── matrix.mtx.gz              # Sparse matrix file (Market Matrix format)
├── metrics_summary.xls            # Analysis metrics summary table
├── raw_matrix/                    # Raw gene expression matrix directory
│   ├── barcodes.tsv.gz            # Raw cell barcode file
│   ├── features.tsv.gz            # Raw gene/feature information file
│   └── matrix.mtx.gz              # Raw sparse matrix file
├── singlecell.csv                 # Single-cell metadata information table
└── *_scRNA_report.html            # Analysis report in HTML format
🎯 Core Content: Result files from aligning raw sequencing data to the reference genome, containing complete alignment information and cell barcode tags.
This is the scRNA-seq alignment result file containing all raw data.
Core Purpose:
Content and Format:
.bai file), allowing for fast random access.Key TAG Field Descriptions:
🧬 Cell and Molecular Identifier Tags:
| Tag | Type | Description | Biological Significance |
|---|---|---|---|
CB |
String | Cell ID after merging cell barcodes | Used to assign reads to a specific cell; it is the final cell ID after error correction and merging. |
CC |
String | Error-corrected cell barcode sequence | The corrected cell barcode, an intermediate step in generating the CB tag. |
CR |
String | Raw sequencing cell barcode | Retains original sequencing information for quality assessment and error tracing. |
CY |
String | Cell barcode quality score | Phred quality score, assessing the reliability of barcode sequencing. |
UB |
String | Error-corrected UMI sequence | Used for molecular deduplication to identify PCR duplicates and original mRNA molecules. |
UR |
String | Raw sequencing UMI sequence | Retains original UMI information for quality assessment and algorithm optimization. |
UY |
String | UMI quality score | Phred quality score, assessing the accuracy of UMI sequencing. |
🧬 Gene Annotation and Functional Tags:
| Tag | Type | Description | Functional Purpose |
|---|---|---|---|
GX |
String | Ensembl ID | The primary ID for gene expression quantification. |
GN |
String | Gene name | Facilitates biological interpretation and supports gene function annotation. |
TX |
String | Transcript ID | Used for transcript-level expression analysis and alternative splicing studies. |
AN |
String | Antisense transcript tag | Identifies antisense RNA, assessing library directionality and non-coding RNA expression. |
RE |
String | Genomic region type | Distinguishes between Exon (E), Intron (N), and Intergenic (I) regions for transcriptome feature analysis. |
The index file for anno_decon_sorted.bam.
The index file is generated by the samtools index command. To accommodate genomes of different sizes, the pipeline automatically selects the appropriate index format (BAI or CSI).
| Format Type | Usage Instructions |
|---|---|
| BAI Format | The default index format, offering the best compatibility and suitable for most analysis tools and genomes. |
| CSI Format | Automatically generated when the BAM file contains chromosomes longer than 512 Mbp (2^29-1 bp) to support very large genomes. |
🎯 Core Content: Single-cell gene expression count matrices, divided into raw and quality-controlled filtered data, using standard sparse matrix or AnnData format.
filter_matrix/)Contains the gene expression count matrix after filtering for high-quality cells, which is the core data for downstream quantitative analysis.
Core Purpose:
Content and Format:
| File Name | Content Description |
|---|---|
barcodes.tsv.gz |
A list of cell IDs, identifying high-quality cells that passed QC. Each line contains one cell ID, corresponding to the column index of the matrix. |
features.tsv.gz |
A gene/feature information file, containing gene ID, name, and type. Each line contains three columns of information, corresponding to the row index of the matrix. |
matrix.mtx.gz |
The gene expression count matrix in Market Matrix format. Contains matrix dimension information and the row, column indices, and values of non-zero elements. |
Format Advantages:
.mtx) only stores non-zero elements, greatly saving storage space.raw_matrix/)Contains the raw gene expression count matrix for all detected cell barcodes (unfiltered).
Core Purpose:
Content and Format:
filter_matrix/ directory.The feature matrix after cell identification and filtering, stored in AnnData (.h5ad) format. It is an alternative and supplement to the contents of the filter_matrix/ directory.
scanpy, seamlessly connecting to downstream analysis.analysis/) 🎯 Core Content: Results of downstream bioinformatics analysis, including cell clustering, differential genes, and post-QC data.
The cell clustering analysis result file in CSV format. It contains each cell's ID, its assigned cluster, dimensionality reduction coordinates, and key QC metrics.
Barcode: Cell IDCluster: The cluster number the cell belongs toUMAP_1, UMAP_2: The 2D coordinates from UMAP dimensionality reductionnGene, nUMI: The number of genes and UMIs detected in each cellA list of differentially expressed genes (marker genes) for each cluster, in CSV format. It records information such as the significance of each gene's expression in a specific cluster and changes in expression levels.
cluster: The cluster number for which the gene is a markergene: Gene nameavg_log2FC: Average log2 fold changep_val_adj: Adjusted p-value, assessing statistical significancepct.1, pct.2: The proportion of cells expressing the gene in the target cluster versus other clustersA single-cell data object that has undergone complete quality control, dimensionality reduction, and clustering analysis, in AnnData (.h5ad) format. It integrates the upstream expression matrix with downstream analysis results.
scanpy for in-depth exploratory analysis or visualization.filter_feature.h5ad by adding the following information:
obs: Contains cell metadata such as clustering results (cluster).obsm: Contains dimensionality reduction coordinates (X_umap).uns: Contains unstructured results such as marker genes (marker_genes).🎯 Core Content: A summary of experimental quality assessment and statistical metrics, providing comprehensive data quality control information.
A summary table of key analysis metrics in Excel format, providing a comprehensive assessment of the overall quality of the experiment.
Core Purpose:
Content and Format:
| Metric Category | Included Content |
|---|---|
| Basic Statistics | Total reads, valid barcode ratio, UMI quality, Q30 base quality, and other basic sequencing metrics. |
| Cell Identification | Estimated number of cells, median genes/UMIs per cell, sequencing saturation, and other cell calling results. |
| Alignment Metrics | Genome alignment rate, transcriptome alignment rate, exon/intron ratio, and other alignment statistics. |
A single-cell level quality control information table in CSV format, recording detailed statistical data for each cell barcode.
Core Purpose:
Content and Format:
An interactive comprehensive analysis report in HTML web format.
Core Purpose:
Content and Format:
Technical Specifications: Detailed descriptions of the standard formats used for output files.
.mtx.gz) The Market Exchange Format (MEX) is a standard format used in single-cell analysis for storing sparse count matrices, offering advantages of space efficiency and high compatibility.
Core Advantages:
File Composition:
| File Name | Description |
|---|---|
matrix.mtx.gz |
A compressed sparse matrix file. The header contains matrix dimensions, and each subsequent line records the position (row/column index) and value of a non-zero element. |
barcodes.tsv.gz |
A compressed cell barcode file. Each line is a cell ID, and the line number corresponds to the matrix's column. The format is, for example, `CELL1_N2`, where `CELL1` is the cell ID and `N2` consists of two barcodes. |
features.tsv.gz |
A compressed feature (gene) file. Each line contains information like gene ID and gene name, and the line number corresponds to the matrix's row. |
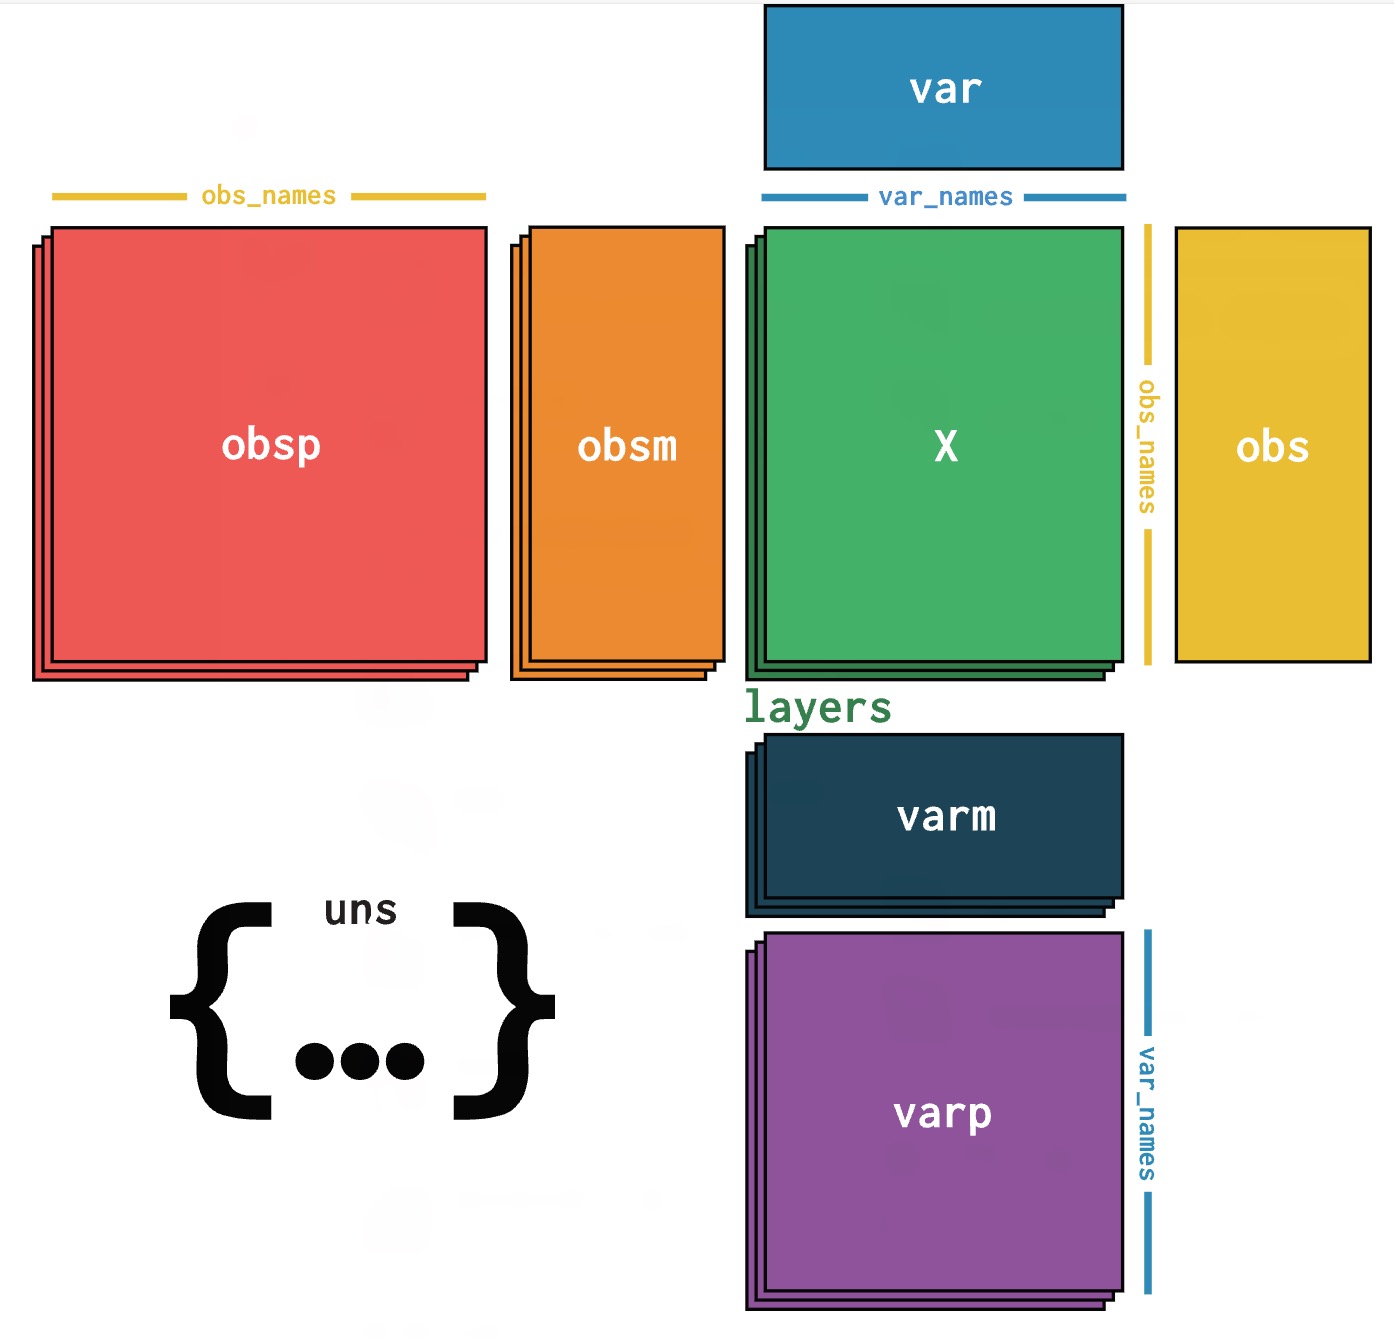
.h5ad) Format Overview: AnnData ("Annotated Data") is a data structure designed for matrix-like data, particularly suitable for single-cell RNA sequencing data analysis. Based on the HDF5 format, it provides efficient data storage and access capabilities.
| 📁 Component | 🎯 Function | 📏 Dimensions |
|---|---|---|
| X | Main expression matrix | n_cells × n_genes |
| obs | Cell metadata | n_cells × n_obs_features |
| var | Gene metadata | n_genes × n_var_features |
| obsm | Cell multidimensional data | n_cells × n_components |
| varm | Gene multidimensional data | n_genes × n_components |
| layers | Multi-layer data | n_cells × n_genes |
| uns | Unstructured data | Any object |
🎯 Overview: The HTML web report provides a comprehensive visual display and detailed interpretation of single-cell RNA sequencing analysis results, including the evaluation of key performance indicators, to help users quickly understand the experimental quality and analysis results.
The HTML web report is a comprehensive display platform for single-cell RNA sequencing analysis, integrating complete results from data quality control to downstream biological analysis. The report uses an interactive visual design to help users quickly assess experimental quality, understand analysis results, and guide future research directions.
💡 Usage Suggestion: It is recommended to review the metrics in the order they are presented in the report.
⚠️ Quality Standards: Each metric is provided with recommended thresholds and quality levels. Please conduct a comprehensive evaluation based on specific experimental goals.
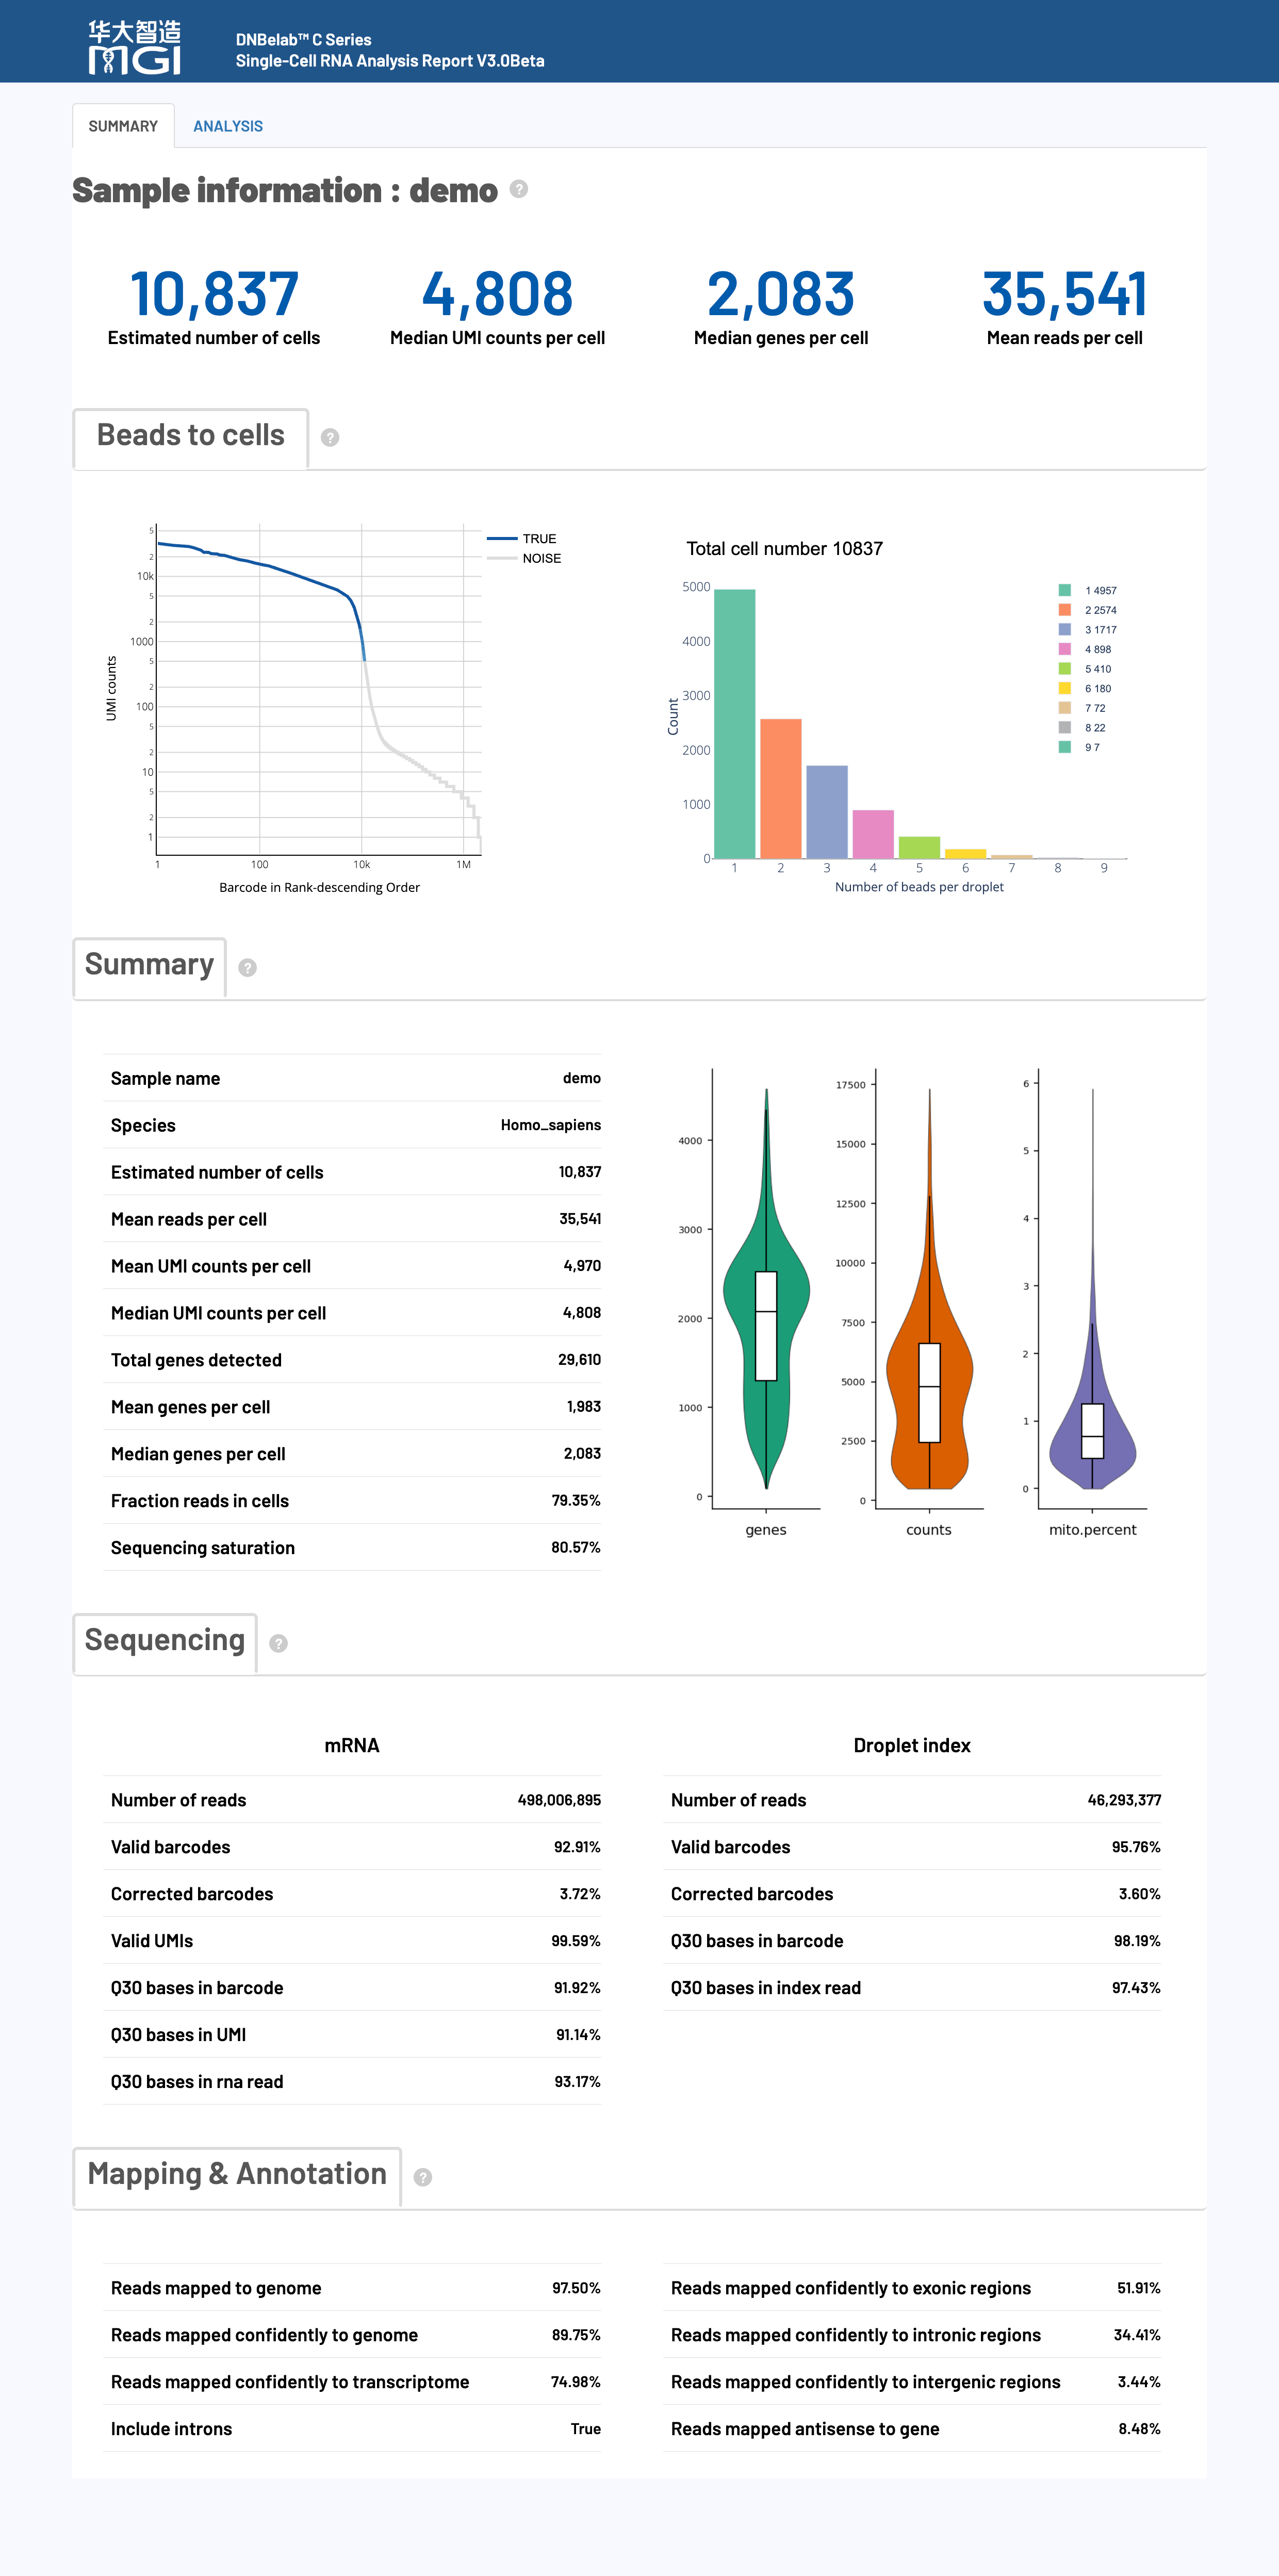
🎯 Core Function: Cell identification, quality assessment, and gene expression statistics, providing key indicators of the overall effectiveness of the experiment.
📊 Quality Control Standards:
Note: The following standards are for reference only. Actual quality assessment should consider multiple factors such as tissue type, cell state, and experimental goals. Significant differences may exist between different samples, and it is recommended to make judgments based on the specific experimental context.
| Metric Name | Recommended | Acceptable | Needs Improvement |
|---|---|---|---|
| Mean reads per cell | ≥ 30,000 | 15,000–30,000 | < 15,000 |
| Median genes per cell | ≥ 1,000 | 500–1,000 | < 500 |
| Fraction reads in cells | ≥ 60% | 30–60% | < 30% |
| Sequencing saturation | ≥ 40% | 20–40% | < 20% |
🔍 Detailed Metric Explanations:
| Metric Name | Detailed Explanation and Technical Requirements |
|---|---|
|
Estimated number of cells Estimated Cell Count |
|
|
Species Species Information |
|
|
Mean reads per cell Mean Reads per Cell |
|
|
Median/Mean UMI per cell Median/Mean UMIs per Cell |
|
|
Median/Mean genes per cell Median/Mean Genes per Cell |
|
|
Total genes detected Total Genes Detected |
|
|
Fraction reads in cells Fraction of Reads in Cells |
|
|
Sequencing saturation Sequencing Saturation |
|
🎯 Core Function: Basic quality assessment of sequencing data, including barcode identification rate, UMI quality, and sequencing accuracy.
📊 Quality Control Standards:
Note: The following standards are for reference only. Actual quality assessment should consider multiple factors such as tissue type, cell state, and experimental goals. Significant differences may exist between different samples, and it is recommended to make judgments based on the specific experimental context.
| Metric Category | Recommended | Acceptable | Needs Improvement |
|---|---|---|---|
| Valid barcodes | ≥ 80% | 70–80% | < 70% |
| Valid UMIs | ≥ 80% | 70–80% | < 70% |
| Q30 Base Quality | ≥ 85% | 75–85% | < 75% |
🔍 Detailed Metric Explanations:
| Metric Name | Detailed Explanation and Technical Requirements |
|---|---|
|
Number of reads Total Number of Reads |
|
|
Valid barcodes Valid Barcode Fraction |
|
|
Valid UMIs Valid UMI Fraction |
|
|
Q30 bases in barcode/UMI/read Q30 Base Fraction |
|
Note: All proportions above are calculated based on the total number of raw sequencing reads (Number of Reads), ensuring comparability and consistency across metrics.
🎯 Core Function: To assess the quality of read alignment to the reference genome, including alignment rate, specificity, and genomic region distribution.
📊 Quality Control Standards:
Note: The following standards are for reference only. Actual quality assessment should consider multiple factors such as tissue type, cell state, and experimental goals. Significant differences may exist between different samples, and it is recommended to make judgments based on the specific experimental context.
| Metric Name | Recommended | Acceptable | Needs Improvement |
|---|---|---|---|
| Reads mapped to genome | ≥ 80% | 50–80% | < 50% |
| Reads mapped confidently to transcriptome | ≥ 50% | 30-50% | < 30% |
| Reads mapped antisense to gene | < 10% | 10-30% | > 30% |
🔍 Detailed Metric Explanations:
| Metric Name | Detailed Explanation and Technical Requirements |
|---|---|
|
Reads mapped to genome Genome Alignment Rate |
|
|
Reads mapped confidently to genome Confident Genome Alignment Rate |
|
|
Reads mapped confidently to transcriptome Confident Transcriptome Alignment Rate |
|
|
Reads mapped confidently to exonic regions Exonic Region Alignment Rate |
|
|
Reads mapped confidently to intronic regions Intronic Region Alignment Rate |
|
|
Reads mapped confidently to intergenic regions Intergenic Region Alignment Rate |
|
|
Reads mapped antisense to gene Antisense Alignment Rate |
|
|
Include introns Include Introns |
|
Note: All proportions above are calculated based on the total number of raw sequencing reads (Number of Reads), ensuring comparability and consistency across metrics.
🎯 Core Function: Provides comprehensive data visualization analysis, from cell quality control to a complete display of downstream biological analysis.
Chart Function:
This plot distinguishes high-quality real cells from background noise by ranking all cells by their UMI count.
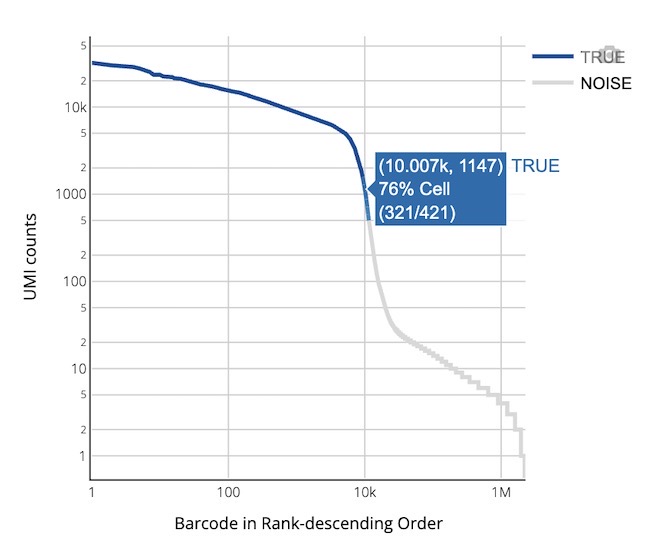
How to Interpret:
Chart Function:
Displays the distribution of the number of captured cell barcodes (Beads) in real cell droplets.
How to Interpret:
Chart Function:
Through three separate violin plots, it shows the distribution of high-quality cells across three key quality metrics: number of genes (nGenes), number of UMIs (nUMI), and mitochondrial gene percentage (percent.mt).
How to Interpret:
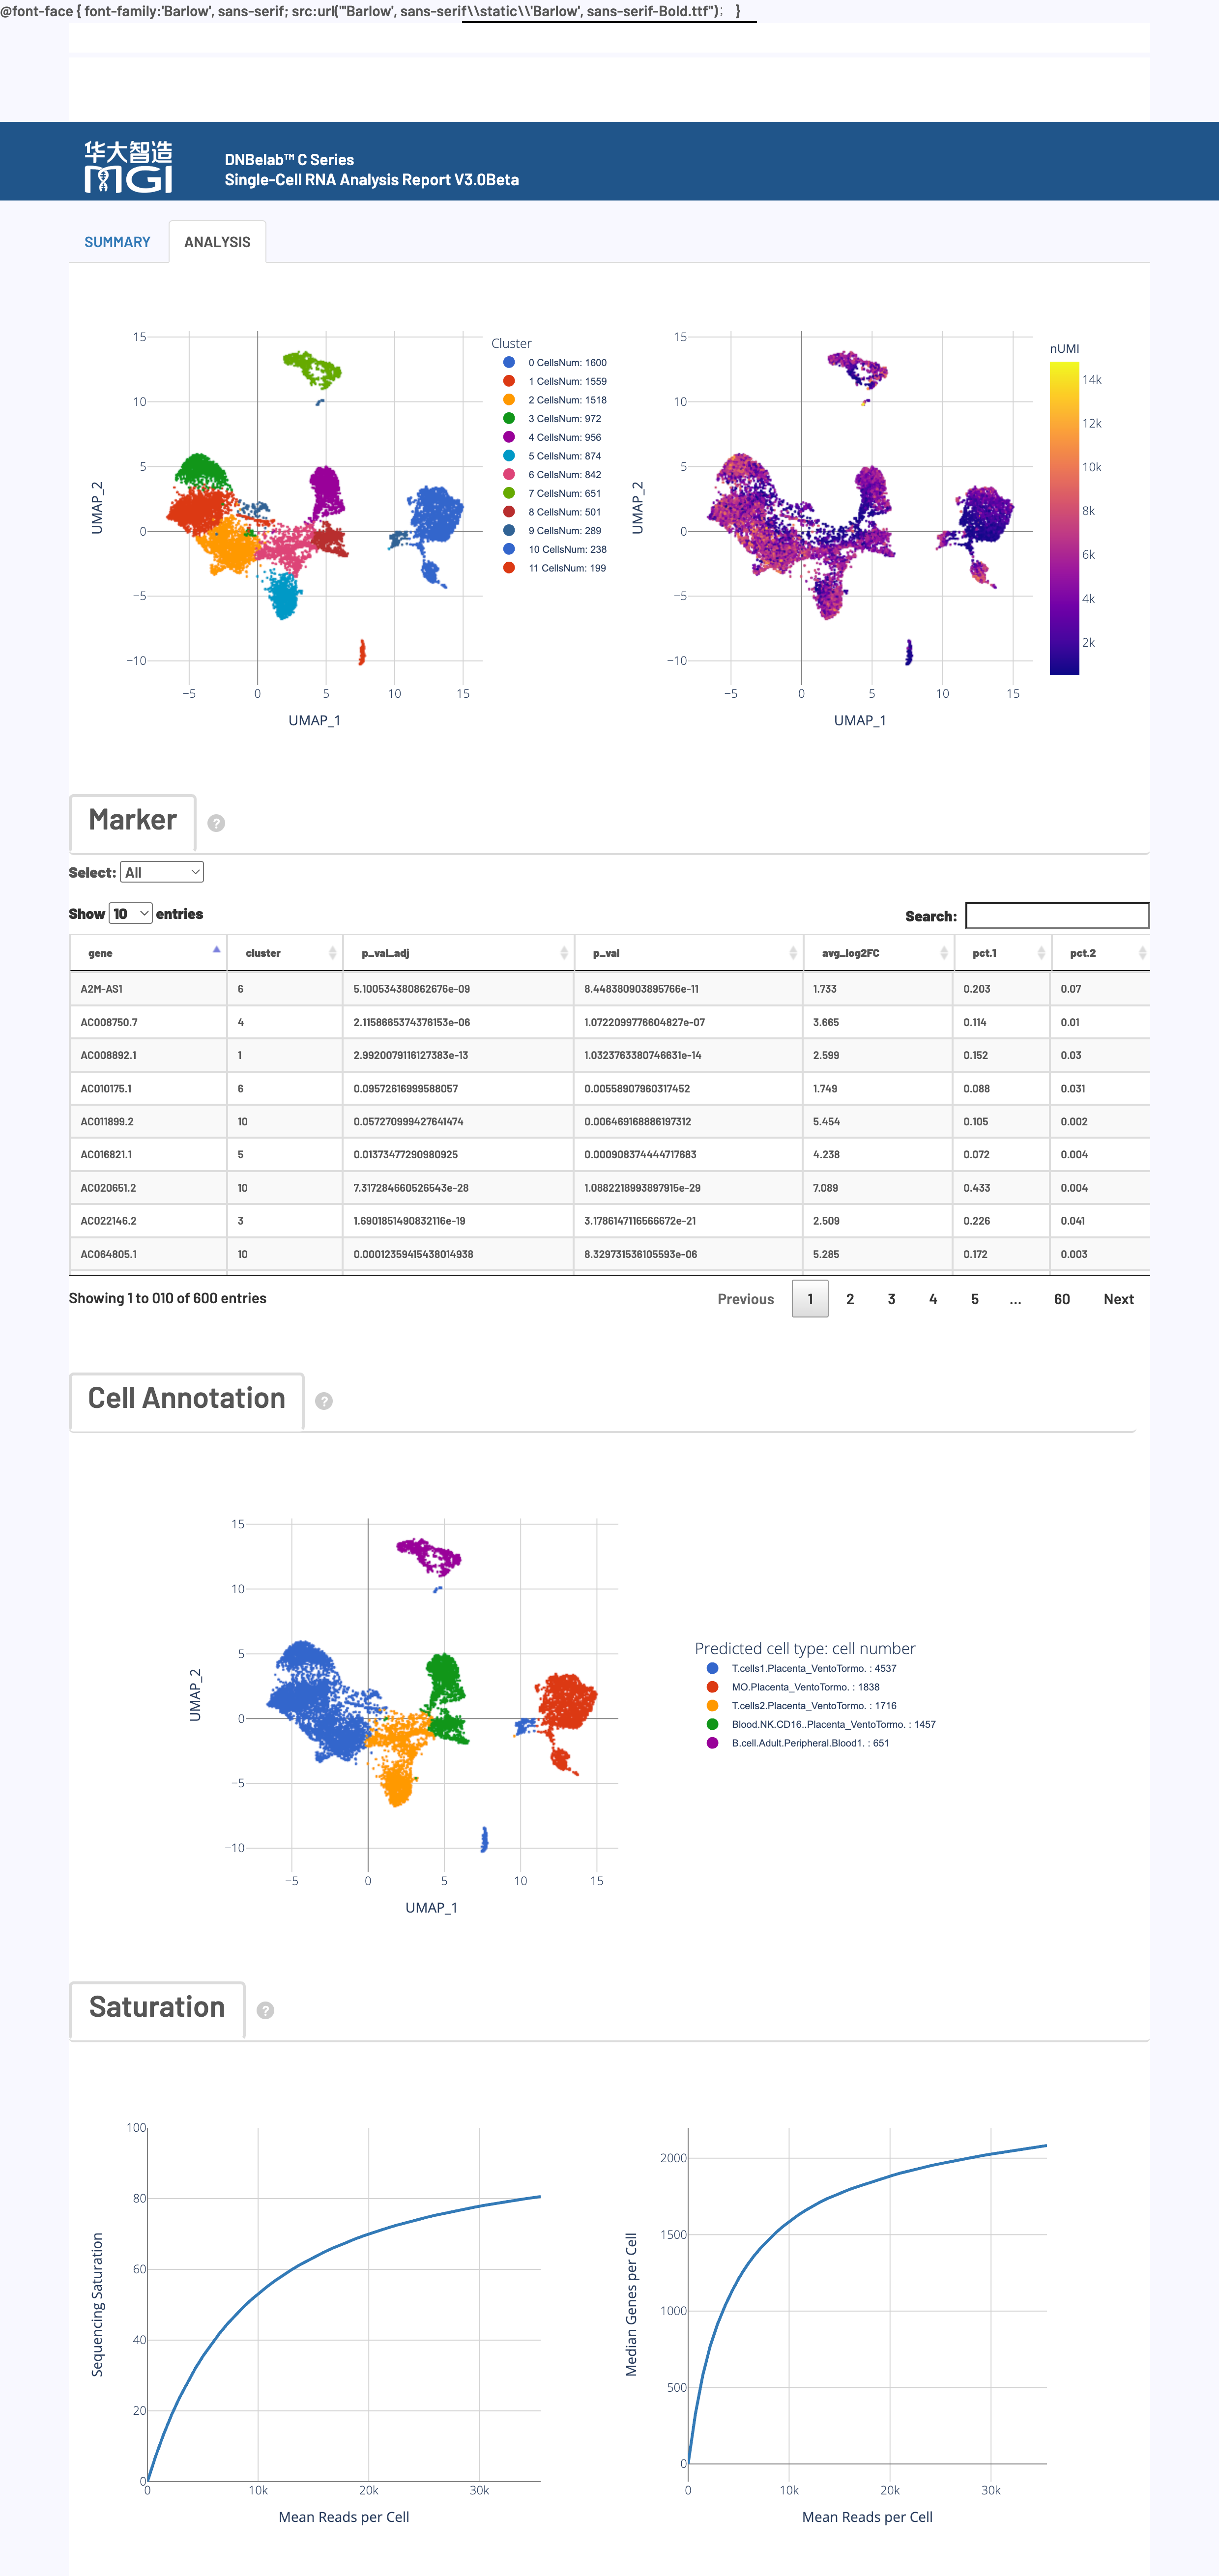
🎯 Core Function: A comprehensive display of cell clustering analysis, differential gene identification, cell type annotation, and sequencing depth assessment.
Chart Function:
Using UMAP dimensionality reduction and the Louvain clustering algorithm, cells with similar gene expression patterns are grouped together in a 2D space, thereby identifying potential cell subpopulations.
How to Interpret:
Chart Function:
Displays the characteristic differentially expressed genes for each cell cluster, used to identify and annotate different cell types.
How to Interpret:
Chart Function:
On the UMAP plot, each cluster is labeled with a cell type inferred from a reference database (e.g., scHCL, scMCA).
How to Interpret:
Chart Function:
Assesses the adequacy of sequencing depth and data complexity, i.e., whether further increasing the sequencing volume can lead to the discovery of more new genes or UMIs.
How to Interpret:
| Document Type | Resource Link and Description |
|---|---|
| 🚀 Quick Start | Quick Start Guide - A complete tutorial for your first analysis. |
| ⚙️ Parameter Reference | Parameter Reference Manual - Detailed descriptions of all configurable parameters. |
| 🔬 Analysis Pipeline | Analysis Pipeline Description - Technical details of the entire analysis pipeline. |
| 🔧 Installation & Configuration | Installation & Configuration Guide - System requirements, installation steps, and environment configuration. |
💡 Tip
This document is continuously updated. If you find any errors or need additional information, please provide feedback.
📝 Document Version: 3.0 beta | Last Updated: 2025
🔬 DNBelab C Series HT scRNA Analysis Software
A High-Performance Single-Cell RNA Sequencing Data Analysis Pipeline