🧬 DNBelab C Series HT scATAC Analysis Output Documentation
📖 Overview
After the single-cell ATAC sequencing analysis is complete, a standardized structure of files and subdirectories is generated in the specified output directory, specifically for chromatin accessibility analysis and epigenomic research. This document details the content, format, and purpose of each output file to help users fully understand and efficiently utilize the scATAC analysis results.
💡 Tip: All output files use standard formats compatible with mainstream single-cell epigenomic analysis tools (e.g., Signac, ArchR), adhering to internationally accepted data format standards.
📁 Directory Structure
.
├── alignment.fragments.sorted.tagged.bam       # QC-filtered alignment results (requires 'need_bam' parameter for analysis)
├── alignment.fragments.sorted.tagged.bam.bai   # Index file for the alignment results
├── filter_peak_matrix/                         # Directory for the filtered peak matrix in MEX format
│   ├── barcodes.tsv.gz                         # Barcode information for filtered cells
│   ├── matrix.mtx.gz                           # Peak signal data in sparse matrix format for filtered data
│   └── peaks.bed.gz                            # Peak position information for filtered data
├── fragments.tsv.gz                            # Contains all fragments aligned to the genome
├── fragments.tsv.gz.tbi                        # Index file for fragments, for fast random access
├── filtered.fragments.tsv.gz                   # QC-filtered ATAC fragment file, containing only fragments from filtered cells
├── filtered.fragments.tsv.gz.tbi               # Tabix index for the filtered fragments file, for fast querying of genomic intervals
├── metrics_summary.xls                         # Summary table of analysis quality metrics
├── raw_peak_matrix/                            # Directory for the raw peak matrix in MEX format
│   ├── barcodes.tsv.gz                         # Raw cell barcode information
│   ├── matrix.mtx.gz                           # Raw peak signal data in sparse matrix format
│   └── peaks.bed.gz                            # Raw peak position information
├── singlecell.csv                              # Summary table of cell information
└── *_scATAC_report.html                        # Analysis report in HTML format
📋 File Details
🧬 ATAC Fragment and Peak Files
🎯 Core Content: ATAC-seq fragment information and peak identification results, containing complete chromatin accessibility data and cell barcode tags.
-----------
📄 fragments.tsv.gz
fragments.tsv.gz is a compressed TSV file containing ATAC-seq fragment information, which is one of the core data for downstream analysis. Its main features and contents are as follows:
-
Purpose:
- Chromatin Accessibility Analysis: Precisely locate the genomic coordinates of each open chromatin region.
- Data Visualization: Can be directly loaded as a BED file in genome browsers like IGV and UCSC for visualization.
- Downstream Tool Input: Compatible with mainstream single-cell analysis tools such as ArchR and Signac.
-
Content & Format:
-
The file is in BED-like format, with each row representing a unique ATAC-seq fragment.
-
The file contains the 5 columns of information as shown in the table below:
| Field Name |
Description |
chrom |
The name of the reference genome chromosome, identifying the chromosomal location of the fragment. |
chromStart |
The adjusted start position of the fragment on the chromosome (0-based), corrected for the transposase cleavage site. |
chromEnd |
The adjusted end position of the fragment on the chromosome (exclusive), corrected for the transposase cleavage site. |
barcode |
The cell ID identifier, corresponding to the CB tag in the BAM file, used to assign the fragment to a specific cell. |
readSupport |
The total number of read pairs associated with this fragment (including unique and duplicate reads). |
-
Coordinate Adjustment:
- To accurately locate the transposase cleavage site, the fragment intervals in the file are adjusted: the start position is shifted 4bp forward from the leftmost alignment position, and the end position is shifted 5bp backward from the rightmost alignment position.
-----------
📄 fragments.tsv.gz.tbi
The Tabix index file for fragments.tsv.gz.
- Core Purpose:
- Fast Data Access: Allows for rapid, genome-interval-based querying of large
fragments.tsv.gz files without reading the entire file.
- Tool Performance Optimization: Used by tools like ArchR, Signac, and IGV to efficiently load and process data from specific regions.
- Format:
- A standard binary index file generated by the
tabix tool.
-----------
📄 filtered.fragments.tsv.gz
This is the ATAC-seq fragment file after cell quality control and filtering. It is a subset of fragments.tsv.gz, containing only fragments from high-quality cells.
- Core Purpose:
- Core Downstream Analysis: This is the recommended input file for core downstream steps such as cell clustering and differential accessibility analysis.
- Improved Signal-to-Noise Ratio: Using this file improves the accuracy and signal-to-noise ratio of the analysis results by removing low-quality cells and background noise.
- Content & Format:
- The file format is identical to
fragments.tsv.gz (compressed BED-like TSV) and contains the same 5 columns.
- It includes only fragments from barcodes identified as "real cells" by the cell filtering algorithm (e.g., based on TSS enrichment and number of fragments in peaks).
-----------
📄 filtered.fragments.tsv.gz.tbi
The Tabix index file for filtered.fragments.tsv.gz.
- Core Purpose:
- Efficient Downstream Analysis: Ensures that downstream tools (like ArchR, Signac) can quickly and efficiently access data from specific genomic regions when using the filtered fragment file.
- Format:
- A standard binary index file generated by the
tabix tool.
-----------
📄 alignment.fragments.sorted.tagged.bam
This is the ATAC-seq alignment result file containing all fragments that have a valid barcode and were successfully aligned.
-----------
📄 alignment.fragments.sorted.tagged.bam.bai
The index file for alignment.fragments.sorted.tagged.bam.
- Core Purpose:
- Fast Data Access: Allows tools like IGV and Samtools to quickly jump to and read alignment data from any genomic region without loading the entire BAM file.
- Performance Guarantee: Essential for the performance of any tool that performs random access operations on the BAM file.
- Format:
- Standard BAI (BAM Index) format generated by the
samtools index command.
📈 Peak Matrix
🎯 Core Content: The single-cell peak signal count matrix, divided into raw and quality-controlled filtered data, using the standard sparse matrix format.
📁 Filtered Peak Matrix (filter_peak_matrix/)
Contains the peak count matrix after high-quality cell filtering, serving as the core data for downstream quantitative analysis.
-
Core Purpose:
- Downstream Quantitative Analysis: The primary input for analyses such as cell clustering, differential accessibility analysis, and trajectory inference.
- High-Quality Data: Contains only barcodes identified as real cells, ensuring the accuracy of the analysis results.
-
Content & Format:
- Uses the standard Market Matrix Exchange (MEX) format, consisting of the following three compressed files:
| Filename |
Description |
barcodes.tsv.gz |
A list of cell IDs, identifying high-quality cells that passed QC. Each line contains one cell ID, corresponding to a column in the matrix. |
peaks.bed.gz |
A file with peak region coordinates in BED format. Contains chromosome, start, and end positions, corresponding to a row in the matrix. |
matrix.mtx.gz |
The peak region count matrix in Market Matrix format. Contains matrix dimensions and the row, column, and value for non-zero elements. |
-
Format Advantages:
- Space-Efficient: The sparse matrix format (
.mtx) saves significant storage space by only storing non-zero elements.
- Highly Compatible: The MEX format is a standard in the single-cell community, compatible with almost all mainstream analysis tools like Seurat, Signac, Scanpy, etc.
-----------
📁 Raw Peak Matrix (raw_peak_matrix/)
Contains the raw peak count matrix for all detected cell barcodes (without filtering).
-
Core Purpose:
- Quality Control Assessment: Can be used to evaluate the effectiveness of cell filtering or to perform manual filtering based on custom criteria.
- Data Integrity: Preserves all original data, which can be used for deep mining or re-analysis if needed.
-
Content & Format:
- Uses the standard Market Matrix Exchange (MEX) format, with the same file composition as the
filter_peak_matrix/ directory.
- Includes all detected barcodes, including high-quality cells, low-quality cells, and background droplets.
📝 Analysis Summary
🎯 Core Content: A summary of experimental quality assessment and statistical metrics, providing complete data quality control information.
📄 metrics_summary.xls
An Excel-formatted summary table of key analysis metrics, providing a comprehensive assessment of the overall experiment quality.
-
Core Purpose:
- Quality Assessment: Quickly evaluate key metrics such as sequencing data quality, alignment efficiency, and cell identification results.
- Results Overview: Get a comprehensive understanding of the analysis results without having to inspect all files.
-
Content & Format:
- Contains key metrics from three main categories:
| Metric Category |
Includes |
| Basic Stats |
Basic sequencing metrics like total read pairs, valid barcode ratio, Q30 base quality, etc. |
| Cell Calling |
Cell calling results like estimated number of cells, fraction of fragments in peaks, fraction of fragments in TSS, number of peaks detected, TSS enrichment, etc. |
| Alignment |
Alignment statistics like genome alignment rate, mitochondrial DNA ratio, etc. |
- Includes built-in recommended quality control thresholds for user convenience:
Recommended Quality Thresholds:
- ✅ Valid Barcode Ratio: >70%
- ✅ Q30 Base Quality: >75% (Barcode and UMI regions)
- ✅ Genome Alignment Rate: >50%
- ✅ TSS Enrichment Score (Human/Mouse): >4
- ✅ Fraction of Fragments in Peaks: >15%
- ✅ Fraction of Fragments in TSS: >10%
- ✅ Percentage of Duplicate Reads: >10%
-----------
📄 singlecell.csv
A CSV-formatted table of cell-level quality control information, recording detailed statistics for each cell barcode.
-
Core Purpose:
- Fine-grained QC: Allows users to perform more detailed cell filtering and analysis based on custom criteria.
- Downstream Analysis Input: Can be used as cell metadata input for analysis tools like Signac and Scanpy.
-
Content & Format:
- Each row represents one cell barcode.
- Key columns include: number of fragments, number of peaks, number of fragments in TSS/peak regions, whether it is identified as a high-quality cell, bead merging information, etc.
-----------
📄 *_scATAC_report.html
An interactive, comprehensive analysis report in HTML web format.
-
Core Purpose:
- Results Visualization: Intuitively displays key analysis results such as QC metrics, cell clustering, and TSS enrichment in the form of interactive charts.
- Results Interpretation: Provides the biological significance and technical explanation of various metrics to help users interpret the data deeply.
- Easy Sharing: A single HTML file that is easy to circulate and share.
-
Content & Format:
- Can be opened in any modern browser without an internet connection.
- For a detailed interpretation of the report, please refer to the Web Report Interpretation section below.
- Key content modules included are as follows:
| Report Feature |
Description |
| Interactive Charts |
Interactive visualizations for QC metrics, cell clustering, peak analysis, etc. |
| Statistical Summary |
A numerical summary and trend analysis of key performance indicators. |
| Detailed Interpretation |
The biological significance and technical explanation of various metrics. |
Technical Specification: A detailed description of the standard formats used for the output files.
Market Exchange Format (MEX) is a standard format for storing sparse count matrices in single-cell analysis, known for its space efficiency and high compatibility.
-
Core Advantages:
- Space-Efficient: The sparse matrix format only stores non-zero elements, which significantly saves storage space for single-cell data where over 95% of values are typically zero.
- Highly Compatible: As an international standard, it can be directly read by almost all mainstream analysis tools, including Seurat, Scanpy, and Signac.
-
File Composition:
- A complete MEX format dataset consists of the following three files:
| Filename |
Description |
matrix.mtx.gz |
A compressed sparse matrix file. The header contains matrix dimensions, and each subsequent line records the position (row/column index) and value of a non-zero element. |
barcodes.tsv.gz |
A compressed cell barcode file. Each line is a cell ID, and the line number corresponds to the matrix **column**. |
peaks.bed.gz |
A compressed feature (peak) file. Each line is a peak's coordinates in BED format, and the line number corresponds to the matrix **row**. |
📊 Web Report Interpretation
🎯 Overview: The HTML web report provides a comprehensive visualization and detailed interpretation of the single-cell ATAC sequencing analysis results, including an evaluation of key performance indicators to help users quickly understand the experiment's quality and results.
HTML web report is a comprehensive display platform for single-cell ATAC sequencing analysis, integrating complete results from data quality control to downstream epigenomic analysis. The report uses interactive visualization design to help users quickly evaluate experiment quality, understand analysis results and guide subsequent research directions.
💡 Usage Suggestion: It is recommended to review the metrics in the order they are presented in the report.
⚠️ Quality Standards: Recommended thresholds and quality levels are provided for each metric. Please conduct a comprehensive evaluation based on specific experimental goals.
📊 Main Report Content and Structure
🧬 Core Analysis Metrics Explained
🧬 Cell Metrics
🎯 Core Function: Cell identification, quality assessment, and chromatin accessibility statistics, providing key indicators for the overall effectiveness of the experiment.
📊 Quality Control Standards:
Note: The following standards are for reference only. Actual quality assessment should consider factors such as organism type, cell state, and experimental goals. Differences between samples may exist. It is recommended to combine specific experimental background for judgment.
| Metric Name |
Recommended |
Acceptable |
Needs Improvement |
| Median fragments per cell |
≥ 10,000 |
2,000–10,000 |
< 2,000 |
| TSS enrichment score |
≥ 6 |
4–6 |
< 4 |
| Median fraction of fragments overlapping peaks |
≥ 30% |
15–30% |
< 15% |
| Median fraction of fragments overlapping TSS |
≥ 20% |
10–20% |
< 10% |
| Fraction fragments in cells |
≥ 50% |
20–50% |
< 20% |
🔍 Detailed Metric Explanations:
| Metric Name |
Detailed Explanation & Technical Requirements |
Estimated number of cells
|
- Definition: The total number of valid cells identified from the sequencing data (as distinct from background noise or empty droplets).
- Calculation Process: After merging barcodes from the same droplet, cells are filtered based on parameters like the number of fragments in peak regions and TSS proportion.
- Quality Interpretation:
- Abnormal Causes: Inaccurate cell counting, poor cell lysis, poor sample or library quality, low sequencing depth.
|
Species
|
- Definition: The species or reference genome version used for the analysis.
- Note: This information is derived from the reference genome provided during library preparation and is used to ensure the accuracy of alignment and annotation.
|
Median fragments per cell
|
- Definition: The median number of valid ATAC-seq fragments contained within a single cell.
- Biological Significance: This metric directly reflects the capture efficiency of open chromatin regions within a single nucleus and the sequencing depth. A higher value indicates better single-cell data quality.
- Quality Interpretation:
- High-Quality Standard: ≥ 10,000
- Recommended Minimum: ≥ 2,000
- Note: This value is highly dependent on cell type and sequencing depth.
|
Mean raw read pairs per cell
|
- Definition: The average number of raw sequencing read pairs assigned to each cell.
- Calculation: `Total Raw Read Pairs / Estimated Number of Cells`
- Quality Interpretation: A value of ≥ 25,000 is recommended to ensure adequate chromatin coverage.
|
Fraction overlapping peaks
|
- Definition: The proportion of a single cell's fragments that fall into identified open chromatin regions (Peaks).
- Biological Significance: This is a key signal-to-noise ratio metric. A high proportion indicates that transposase activity was more concentrated in open chromatin, resulting in a high signal-to-noise ratio.
- Quality Interpretation:
- Quality Warning: < 15% may indicate sample quality issues.
|
Fraction overlapping TSS
|
- Definition: The proportion of a single cell's fragments that fall within the ±2kb region of a Transcription Start Site (TSS).
- Biological Significance: A key metric for assessing chromatin activity in promoter regions and sequencing specificity.
- Quality Interpretation:
- Quality Warning: < 10% may indicate sample quality issues.
|
Fraction of fragments in cells
|
- Definition: The proportion of all valid fragments that are successfully assigned to a high-quality cell ID.
- Biological Significance: Reflects the efficiency of cell capture and the signal-to-noise ratio.
- Quality Interpretation:
- High-Quality Sample: A high ratio (e.g., > 50%) indicates high cell capture efficiency and low background noise.
- Quality Issue: A low ratio may indicate poor sample quality or library construction anomalies.
|
Number of peaks
|
- Definition: The total number of open chromatin regions (peaks) identified across the genome after aggregating the signal from all cells.
- Biological Significance: Reflects the overall complexity of the sample and the number of detectable regulatory elements.
- Influencing Factors: Affected by the number of cells, cell type heterogeneity, and sequencing depth.
- Typical Range: 50,000 – 150,000 peaks.
|
-----------
🔬 Sequencing Metrics
🎯 Core Function: Basic quality assessment of sequencing data, including barcode identification rate, alignment quality, and sequencing accuracy.
📊 Quality Control Standards:
Note: The following standards are for reference only. Actual quality assessment should consider factors such as organism type, cell state, and experimental goals. Differences between samples may exist. It is recommended to combine specific experimental background for judgment.
| Metric Category |
Recommended |
Acceptable |
Needs Improvement |
| Valid barcodes |
≥ 80% |
70–80% |
< 70% |
| Q30 bases in barcode |
> 85% |
75–85% |
< 75% |
| Q30 bases in read |
> 85% |
75–85% |
< 75% |
| Reads mapped to genome |
> 80% |
50–80% |
< 50% |
🔍 Detailed Metric Explanations:
| Metric Name |
Detailed Explanation & Technical Requirements |
Total read pairs
|
- Definition: The total number of raw sequencing read pairs allocated to the sample.
- Significance: Represents the overall volume of sequencing data.
|
Valid barcodes
|
- Definition: The proportion of reads whose cell barcode sequence can be successfully matched to the predefined whitelist (with error correction).
- Biological Significance: Reflects the effectiveness of cell labeling.
- Quality Interpretation: A low proportion usually suggests issues in library construction (e.g., barcode degradation, contamination) or a high sequencing error rate.
|
Reads mapped to genome
|
- Definition: The proportion of all reads that successfully align to any location on the reference genome.
- Quality Interpretation:
- Needs Attention: < 50% may indicate sample contamination or species mismatch.
|
Mitochondria reads ratio
|
- Definition: The proportion of all aligned reads that map to the mitochondrial genome.
- Biological Significance: This is an important indicator of cell health.
- Quality Interpretation: An excessively high ratio (e.g., > 10%) often suggests cell death or excessive lysis, leading to the capture of a large amount of mitochondrial DNA from the cytoplasm.
|
Nucleosome-free regions
|
- Definition: The proportion of fragments originating from open chromatin regions (i.e., nucleosome-free regions).
- Biological Significance: Reflects the strength of the valid ATAC-seq signal.
- Quality Interpretation: A high proportion (e.g., > 40%) indicates good chromatin accessibility and efficient transposase activity.
|
Mono-nucleosome regions
|
- Definition: The proportion of fragment regions containing a single nucleosome.
- Biological Significance: Reflects the integrity of the chromatin structure. This metric, together with the 'Nucleosome-free regions' proportion, is used to assess the chromatin state.
|
Q30 bases in barcode
|
- Definition: The proportion of bases with a sequencing quality score of Q30 or higher in the cell barcode sequence.
- Significance: Q30 represents a sequencing error rate of less than 0.1%. This metric directly affects the accuracy of cell identification.
|
Q30 bases in read
|
- Definition: The proportion of bases with a sequencing quality score of Q30 or higher in the sequencing read.
- Significance: Reflects the overall quality level of the sequencing data and is fundamental to the accuracy of subsequent alignment and fragment identification.
|
-----------
📈 Visualization Chart 1
🎯 Core Function: Multi-dimensional visualization for cell quality control, fragment analysis, and chromatin accessibility assessment.
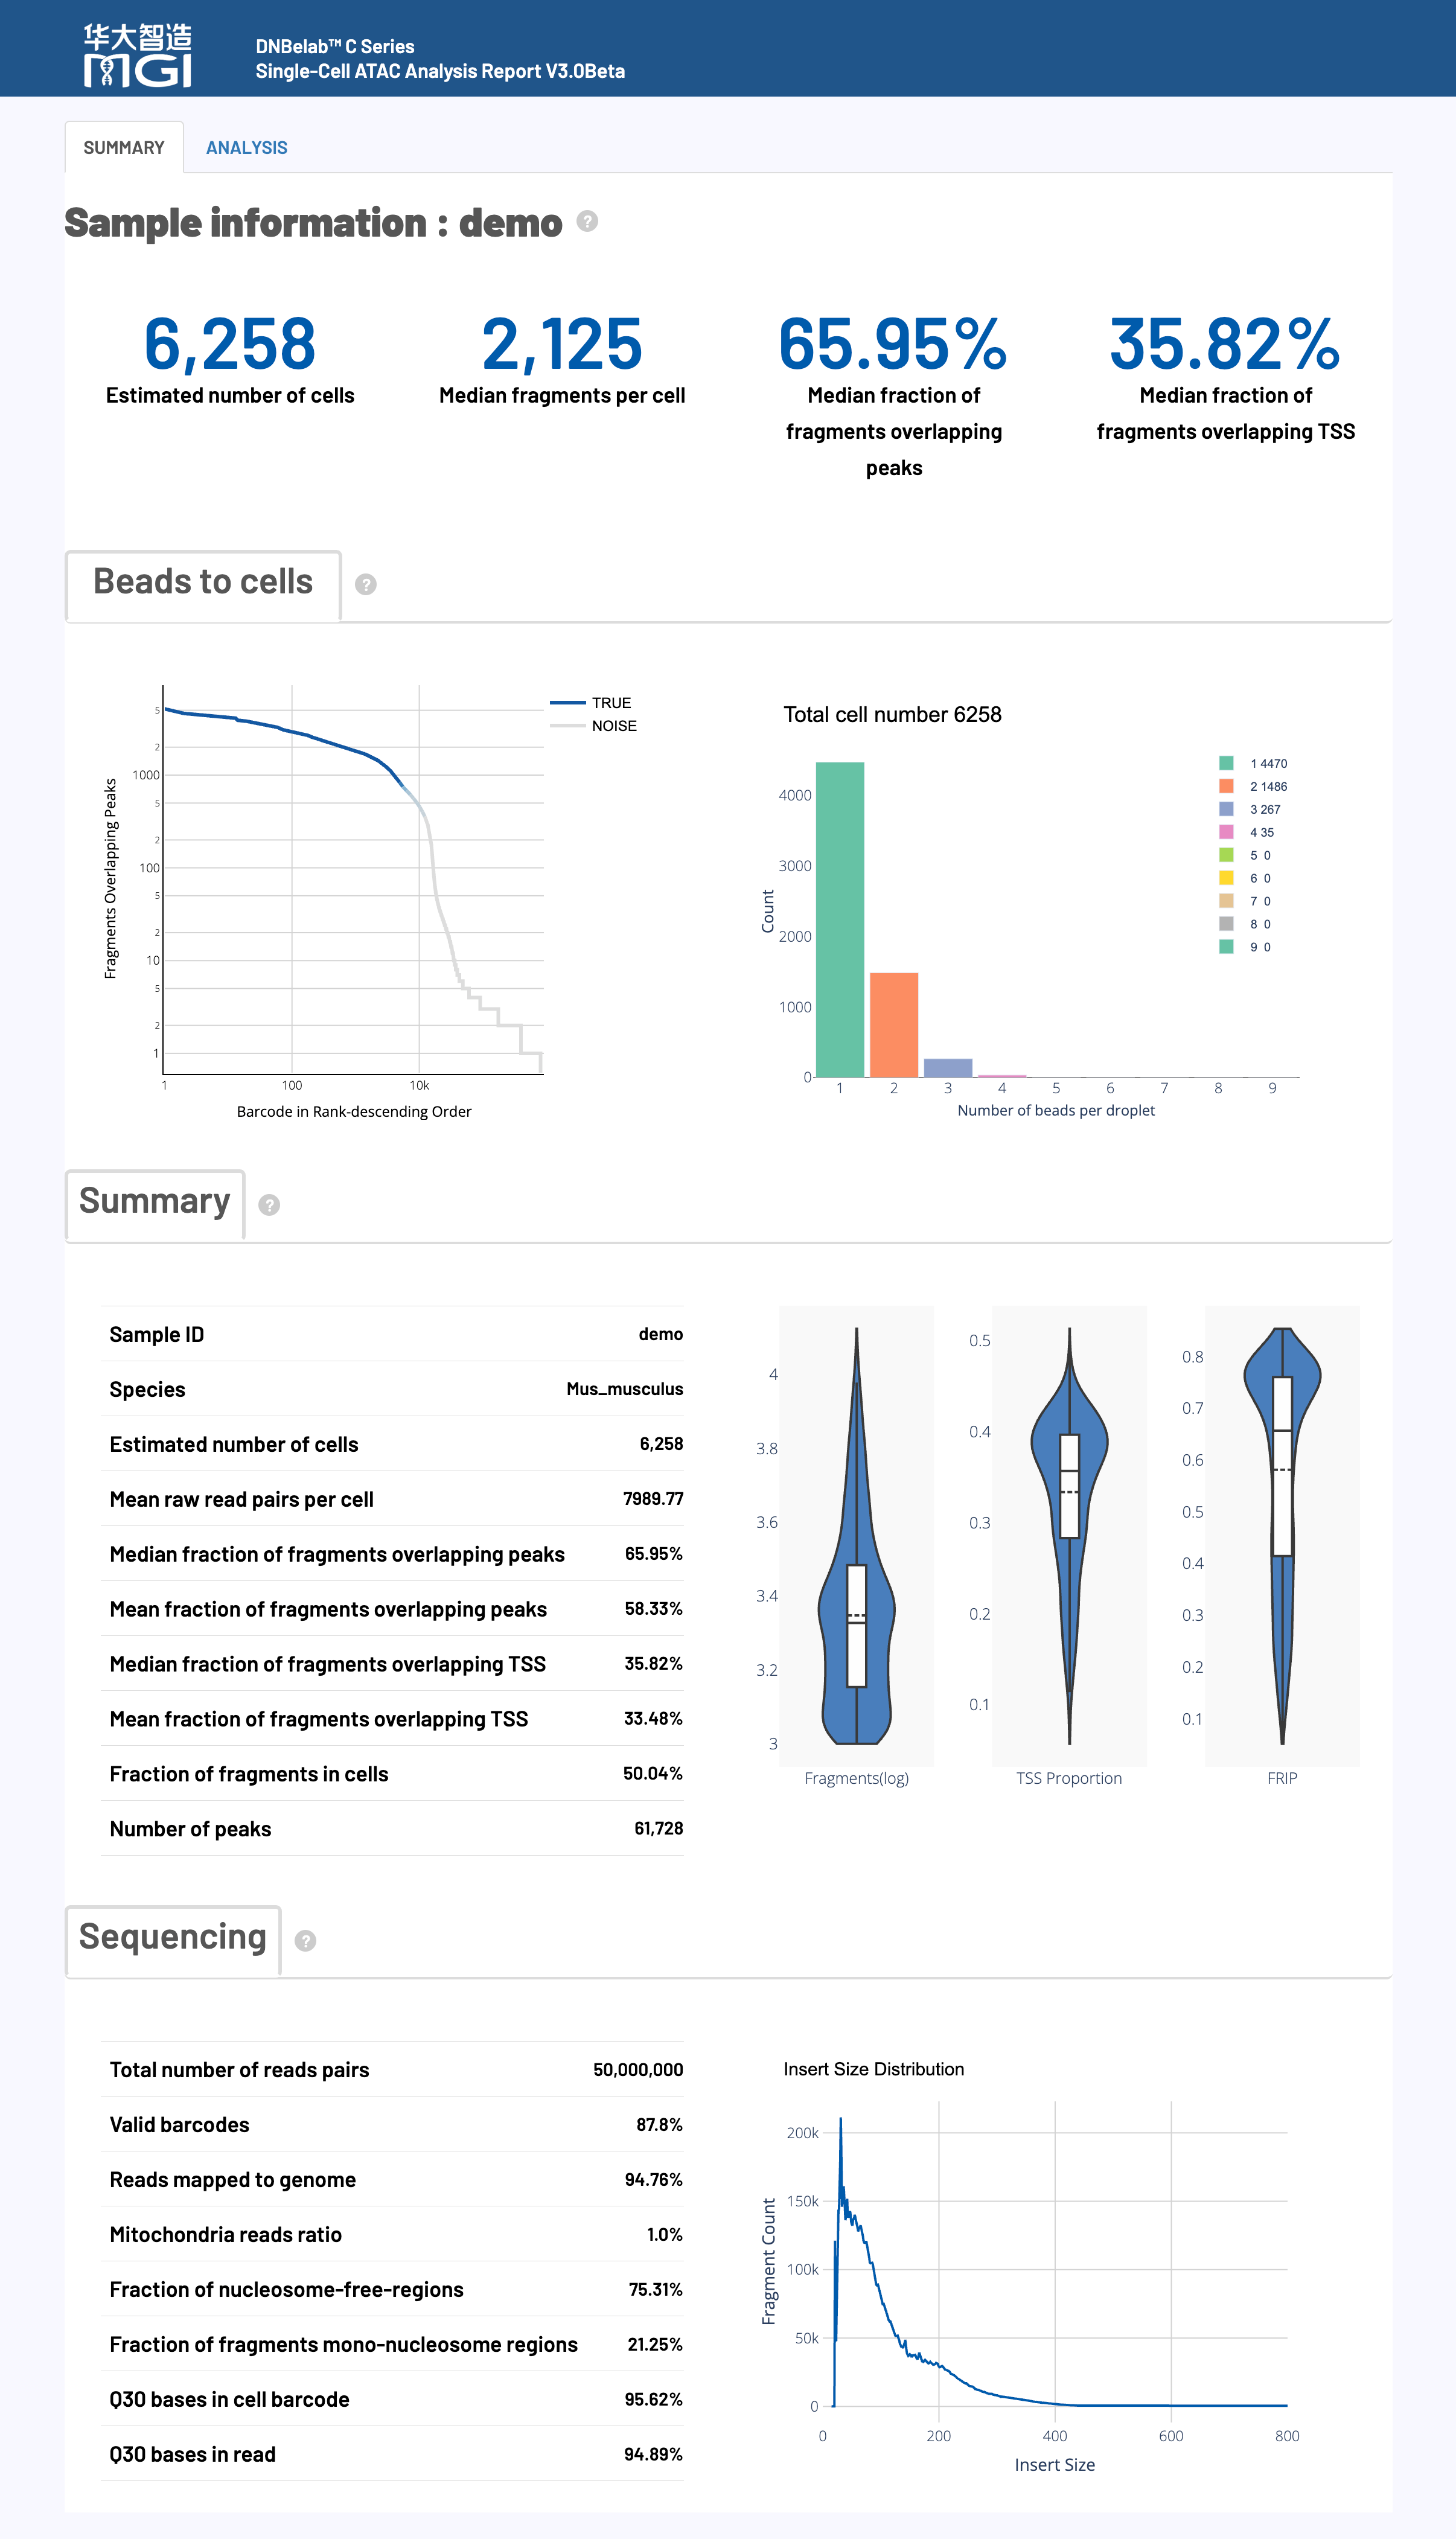
📊 Barcode Rank Plot
Chart Function:
This plot distinguishes high-quality real cells from background noise by ranking all cell barcodes by their fragment count.
How to Interpret:
- Axes:
- X-axis (Barcode Rank): All cell barcodes are ranked in descending order by fragment count. The left side represents high-fragment cells, and the right side represents low-fragment cells.
- Y-axis (Fragment Counts): The total number of fragments in peak regions for each cell (log scale).
- Key Feature (Knee Point):
- The curve typically shows a distinct "knee point".
- The blue area to the left of the knee represents the population identified as high-quality real cells.
- The gray area to the right represents background noise.
- Interactive Features:
- Hovering over a point displays the cell's rank and fragment count.
- The shade of the blue area corresponds to the density of real cells.
-----------
📊 Droplet Beads Distribution
Chart Function:
Shows the distribution of the number of cell barcodes (Beads) captured in real cell droplets.
How to Interpret:
- Theoretical Distribution: The distribution of beads in droplets theoretically follows a Poisson distribution, reflecting the statistical nature of the random capture process in the micro-reaction system.
- Practical Influences: The final distribution is affected by experimental factors such as sequencing saturation, droplet size uniformity, and cell concentration.
-----------
📊 Cell Data Distribution
Chart Function:
Displays the distribution of three key quality metrics—Fragments, TSS Proportion, and Peak Proportion—for high-quality cells using three separate violin plots.
How to Interpret:
- About Violin Plots:
- The width of the plot indicates the density of cells at that metric value. Wider sections mean more cells are clustered around that value.
- The internal box plot shows statistical information like the median and quartiles.
- Interpreting Each Plot:
- Fragments: Shows the distribution of total fragments per cell. For a good library, the center of the distribution (widest part) should be at a high value.
- TSS Proportion: Shows the distribution of the fraction of fragments in TSS regions. A higher center of distribution indicates a better overall transcriptional activity signal.
- Peak Proportion: Shows the distribution of the fraction of fragments in peak regions. A higher center of distribution indicates a better signal-to-noise ratio.
-----------
📊 Fragment Length Distribution
Chart Function:
Shows the insertion length distribution of deduplicated ATAC-seq fragments, which is a key chart for assessing sample quality and chromatin structure integrity.
How to Interpret:
- Periodic Peaks:
- < 200 bp (mainly ~100bp): The first major peak, representing fragments from Nucleosome-Free Regions (NFR), i.e., open chromatin.
- ~200 bp - ~400 bp: The second peak, representing fragments containing a single nucleosome.
- ~400 bp and above: Subsequent peaks, representing fragments containing di- and tri-nucleosomes, reflecting higher-order chromatin structure.
- Quality Assessment:
- High-Quality Sample: Exhibits clear, periodic peaks (~200bp periodicity); a prominent NFR peak; and potentially a small 10.5bp periodicity from the DNA helix.
- Poor-Quality Sample: A flat curve with no periodic features, which usually implies sample over-lysis and destruction of chromatin structure.
📈 Other Key Metrics
Percent duplicates
- Definition: The proportion of fragments identified as PCR duplicates.
- Biological Significance: This is a key metric for measuring library complexity and sequencing saturation.
- Quality Interpretation:
- A high duplication rate (e.g., > 20-30%) usually indicates that sequencing depth is nearing saturation.
- A very low duplication rate (e.g., < 10%) may suggest insufficient sequencing depth.
-----------
Jaccard threshold
- Definition: The similarity threshold used to determine if any two beads originate from the same cell droplet.
- Technical Background: In C4 ATAC technology, a single droplet may contain multiple beads. To obtain accurate single-cell data, fragments from the same cell must be merged by calculating the similarity of their captured fragments (Jaccard Index).
- Algorithm: The threshold is automatically determined using the Otsu algorithm for optimal differentiation. To ensure analysis quality, the value is floored at 0.02 if the calculated value is lower.
📈 Visualization Chart 2
🎯 Core Function: Advanced visualizations for cell clustering, TSS enrichment patterns, saturation assessment, and bead similarity.
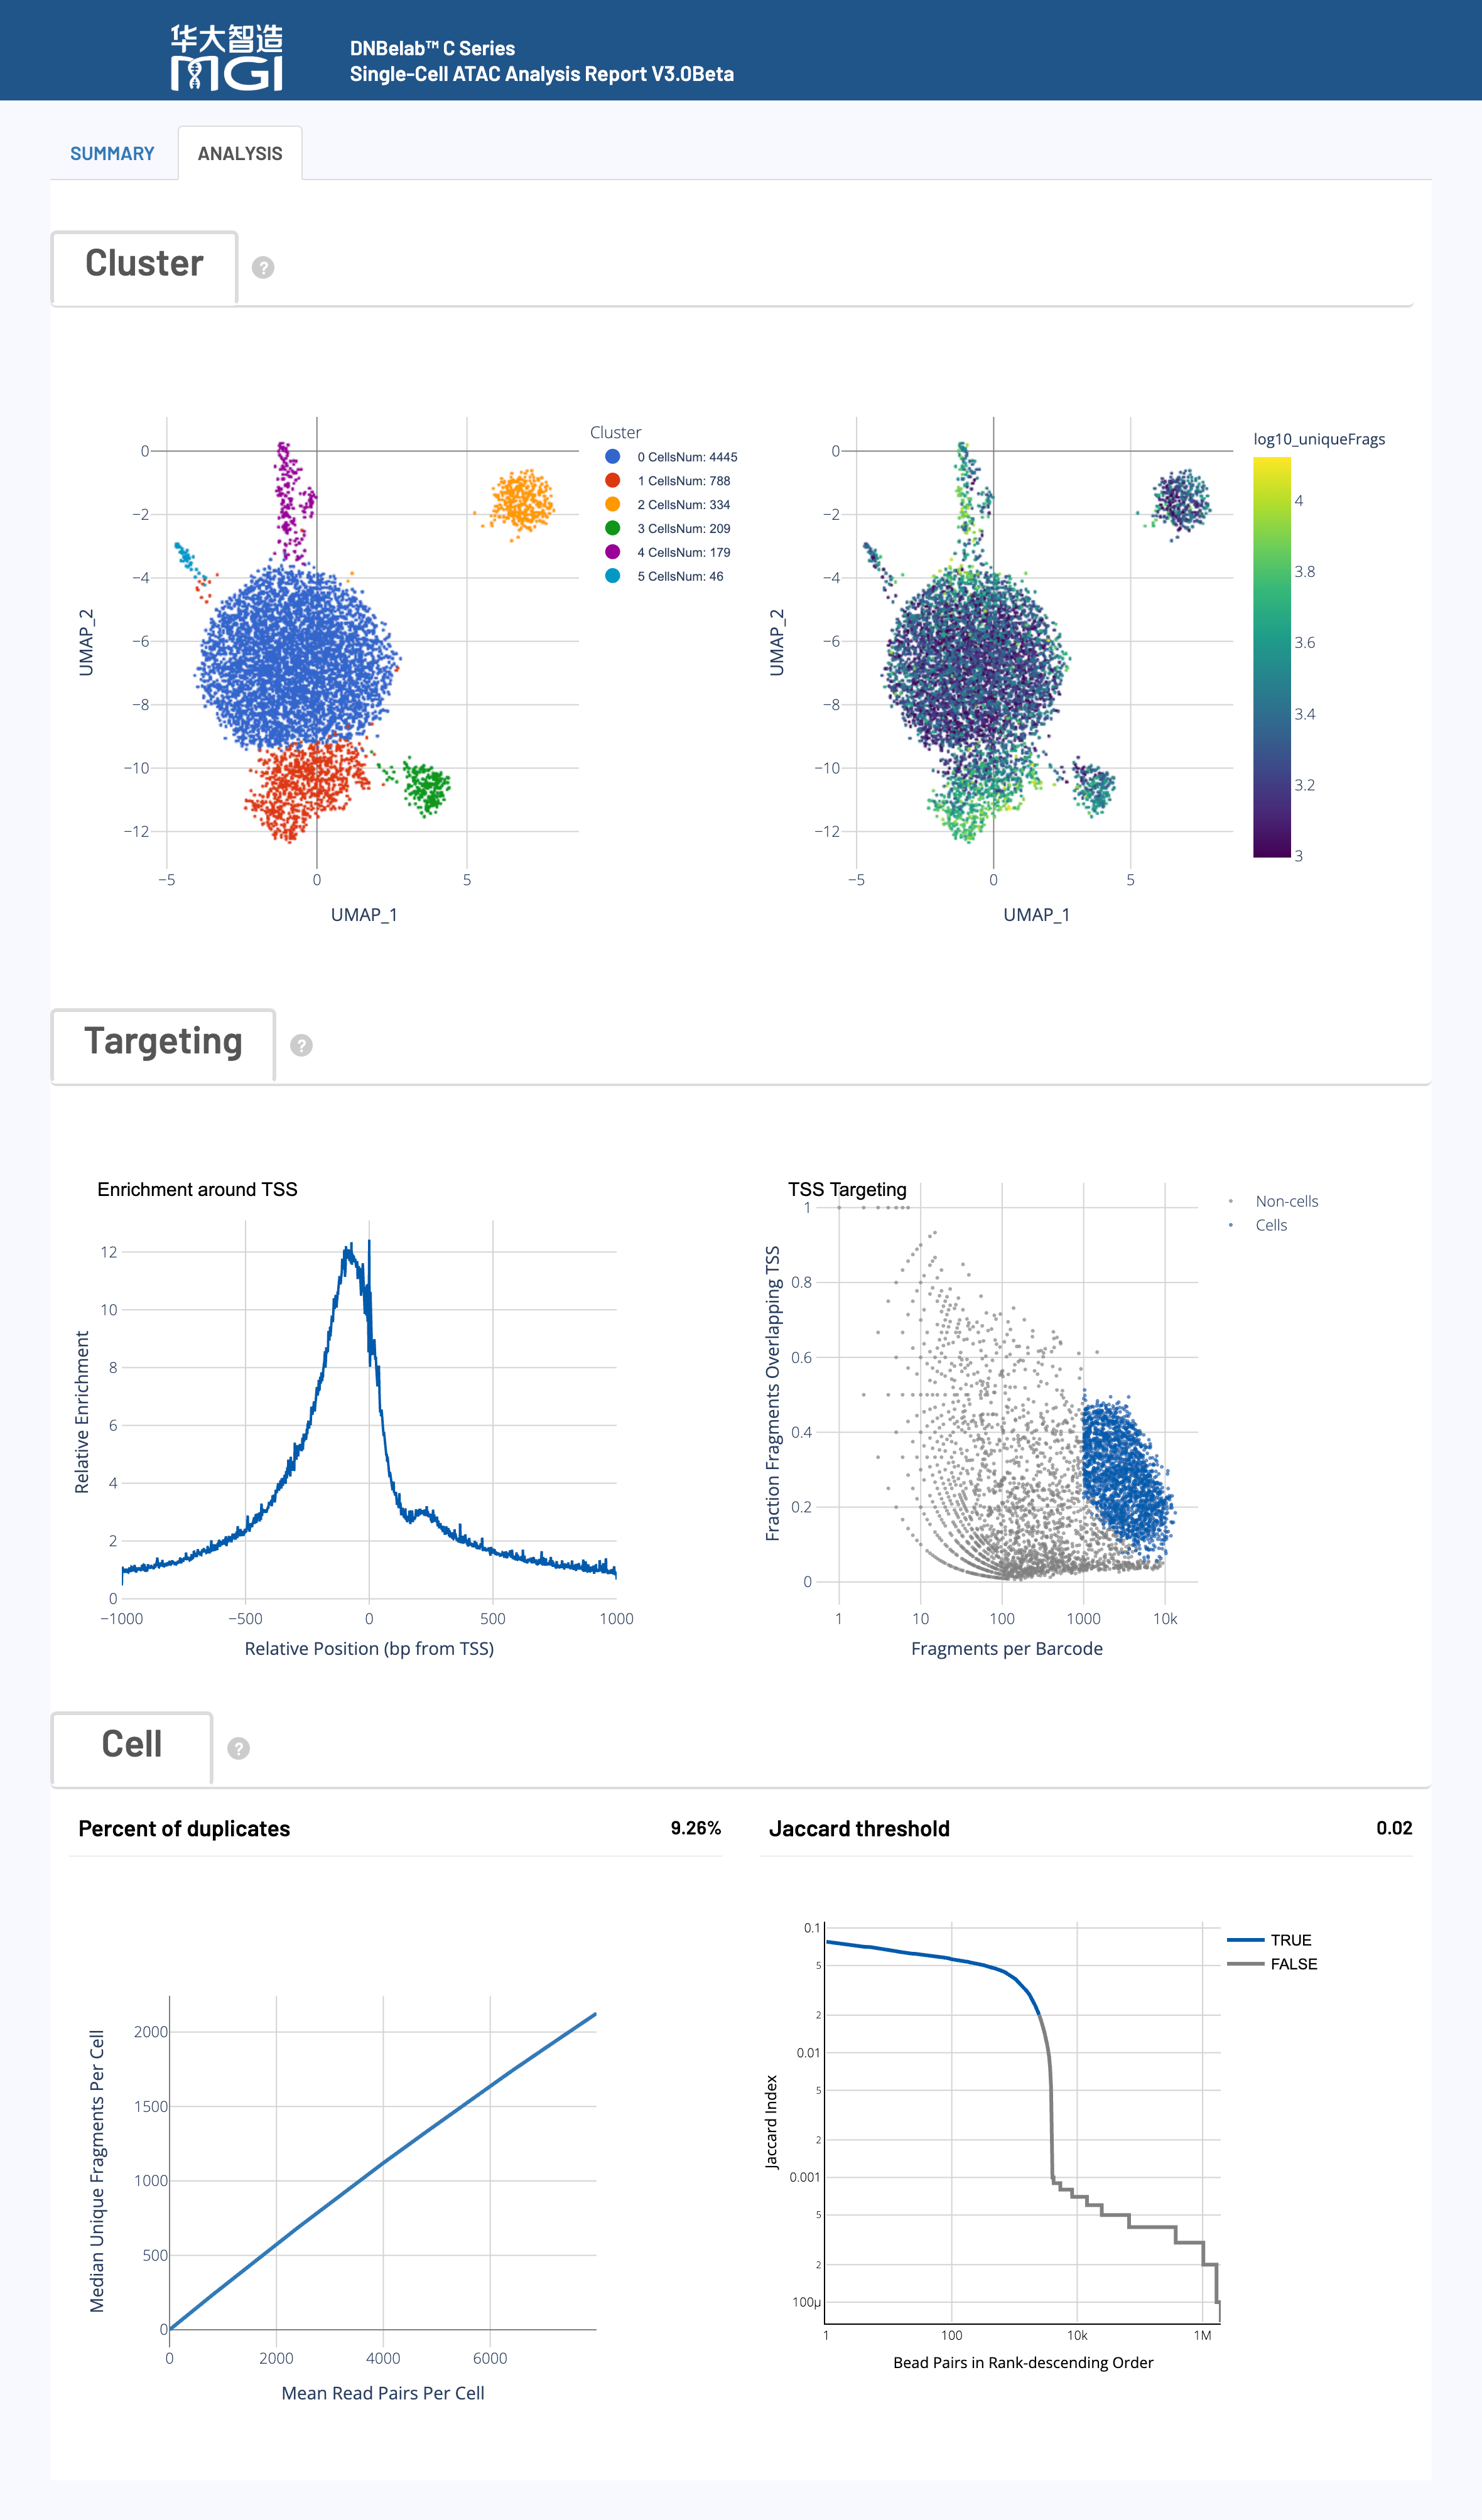
🌀 Cluster Analysis
Chart Function:
Identifies potential cell subgroups by clustering cells with similar chromatin accessibility patterns together in a 2D space using UMAP for dimensionality reduction and Louvain for clustering.
How to Interpret:
- Left Plot (Cell Type Clustering):
- Content: Unsupervised clustering based on chromatin accessibility data using the Louvain algorithm.
- Coordinates: High-dimensional data is projected into 2D space using the UMAP algorithm.
- Interpretation: Each dot is a cell. Different colors represent different clusters, which may correspond to different cell types or states. Cells that are spatially close have more similar open chromatin patterns.
- Right Plot (Fragment Count Distribution):
- Content: Overlays the total fragment count for each cell onto the same UMAP coordinates using a color gradient.
- Interpretation: Deeper colors indicate higher fragment counts and better data quality. This can help validate the reliability of clusters and identify clusters that may be composed of low-quality cells.
-----------
📈 TSS Enrichment Profile
Chart Function:
Displays the enrichment of ATAC-seq fragment cleavage sites around the Transcription Start Sites (TSS) of all genes, serving as a core metric for ATAC-seq signal-to-noise ratio and data quality.
How to Interpret:
- Axes:
- X-axis: Position relative to the TSS (0 is the TSS), typically showing a range of ±1,000 bp.
- Y-axis: Normalized signal intensity (cleavage frequency).
- Key Feature: A high-quality ATAC-seq experiment will show a sharp, prominent enrichment peak at the TSS center (point 0), with the signal dropping off rapidly on either side.
- Quality Assessment:
- The TSS Enrichment Score is the quantitative measure for this plot. A higher score (e.g., > 4-6) indicates a better signal-to-noise ratio and higher data quality.
- A flat curve with no obvious peak suggests poor sample quality or experimental failure.
-----------
📊 Single Cell Targeting Plot
Chart Function:
Evaluates the effectiveness of the cell calling algorithm by displaying two key quality metrics for each cell in a scatter plot.
How to Interpret:
- Axes:
- X-axis (Fragment Counts): The total number of fragments for each cell (log scale).
- Y-axis (TSS Enrichment): The TSS enrichment score for each cell.
- Quality Assessment:
- Top-Right Quadrant: High fragment count + high TSS enrichment. These points are considered high-quality real cells.
- Bottom-Left Quadrant: Low fragment count + low TSS enrichment. These points are considered background noise or empty droplets and are filtered out.
- Ideally, there should be a clear separation between the real cells and the background noise.
-----------
📈 Saturation Curve
Chart Function:
Assesses the sufficiency of sequencing depth and data complexity, i.e., whether further sequencing will yield more unique fragments.
How to Interpret:
- Axes:
- X-axis: The average number of sequencing read pairs per cell (sequencing depth).
- Y-axis: The median number of unique fragments per cell.
- Curve Trend:
- Linear Growth Phase: The curve is steep, indicating that increasing sequencing depth effectively discovers more new fragments (high return on investment).
- Plateau/Saturation Phase: The curve flattens, indicating that the library's complexity has been mostly sequenced, and further sequencing yields diminishing returns.
- Quality Assessment: Saturation (or the duplication rate) is the quantitative metric for this curve. A saturation rate between 20%-50% is recommended to balance cost and data completeness.
-----------
📊 Bead Similarity Ranking
Chart Function:
Used in the C4 ATAC technology to merge multiple beads from the same cell droplet by calculating Jaccard similarity, a key step to ensure unique cell identity.
How to Interpret:
- Technical Background: In C4 ATAC, a single droplet can contain multiple beads. To get accurate single-cell data, fragments originating from the same cell must be merged.
- Axes:
- X-axis: All pairs of beads, ranked in descending order by their Jaccard similarity value.
- Y-axis: The Jaccard similarity index (log scale).
- Merging Strategy:
- Blue Area: Jaccard similarity is higher than the threshold automatically calculated by the Otsu algorithm. These bead pairs are considered to be from the same cell, and their fragments will be merged.
- Gray Area: Jaccard similarity is below the threshold. These are considered beads from different cells and are not merged.
🎯 More Resources
💡 Tip
This document is continuously updated. If you find any errors or have information to add, feedback is welcome.
📝 Document Version: 3.0 beta | Last Updated: 2025
🔬 DNBelab C Series HT scATAC Analysis Software
A High-Performance Pipeline for Single-Cell ATAC Sequencing Data Analysis